Energy Efficiency Metrics for Distributed Testing


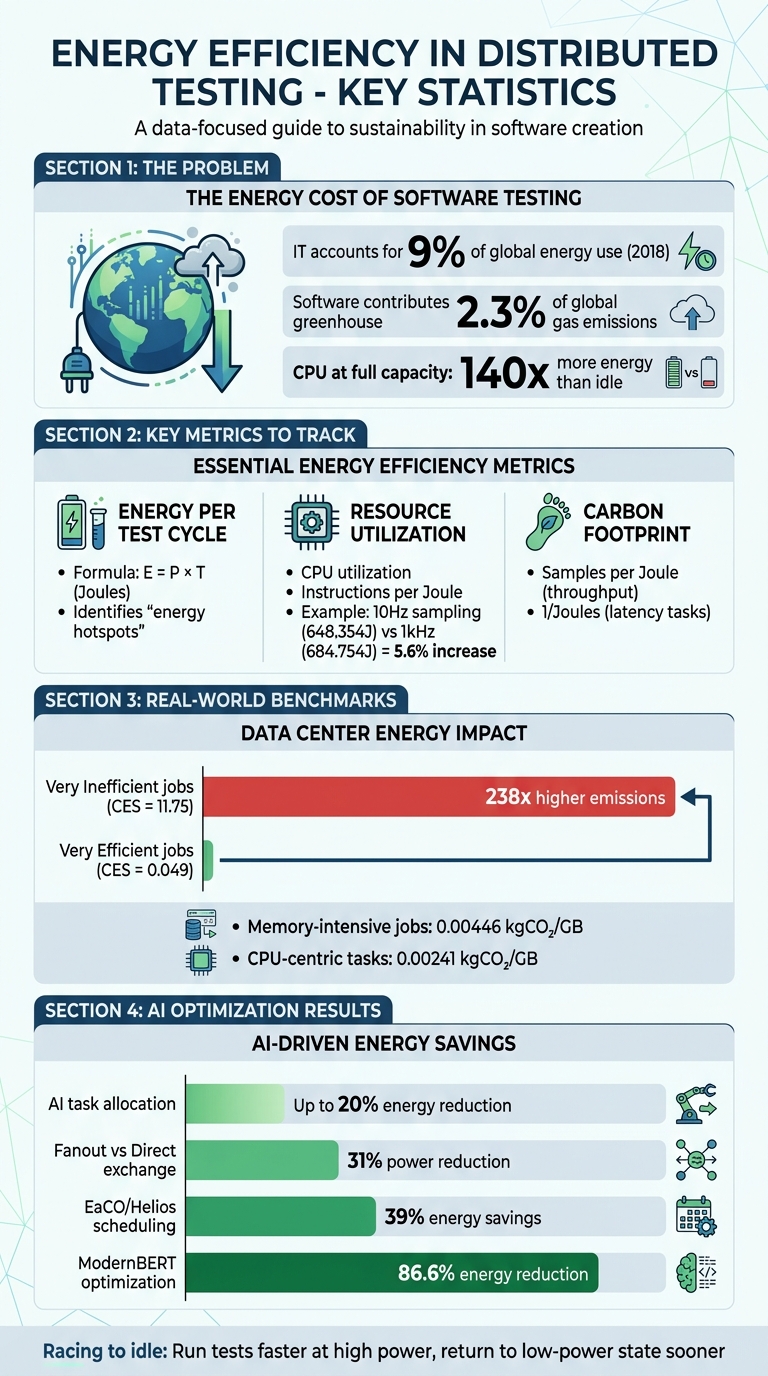
Modern software testing consumes more energy than you might expect. With information technology accounting for 9% of global energy use in 2018 and software contributing 2.3% of global greenhouse gas emissions, energy-efficient testing isn't just about saving costs - it's about reducing environmental impact. Distributed testing systems, which run tests across multiple environments, provide a way to balance speed, scalability, and energy use.
Here’s what you need to know:
- Energy Use in Testing: A CPU at full capacity can consume 140x more energy than idle. Tracking energy per test cycle helps identify inefficiencies.
- Resource Efficiency: Metrics like CPU utilization and "instructions per Joule" measure hardware efficiency. For example, running tests faster to let CPUs return to idle saves energy.
- Carbon Footprint: Testing's energy use translates directly into emissions. Scheduling tests during low-carbon grid times can reduce impact.
- AI Optimization: AI-driven tools like Ranger and algorithms like PSO optimize test distribution, cutting energy use by up to 20%.
Energy Efficiency Metrics for Distributed Software Testing: Key Statistics and Benchmarks
Key Metrics for Measuring Energy Efficiency
Energy Consumption per Test Cycle
One of the core metrics to consider is the energy footprint, which measures the electrical energy consumed during test execution. The formula for this is straightforward: Energy (E) = Power (P) × Time (T), with the result expressed in Joules (J).
To get a clearer picture of your software's energy impact, subtract the idle power (the baseline hardware consumption) from the total energy consumption. This step isolates the energy directly tied to the test execution, offering a more accurate understanding of its true energy cost.
Tracking energy consumption per test cycle can highlight "energy hotspots" - specific methods or processes that use an outsized amount of energy. For instance, automated test generation algorithms often show varying energy demands, especially when dealing with classes that have high cyclomatic complexity. Interestingly, some studies have found that manual tests may consume more energy than automated ones, even without providing better code coverage.
By using a QA metrics analyzer to focus on these metrics, teams can pinpoint inefficiencies and work toward reducing unnecessary energy usage.
Resource Utilization Efficiency
Resource utilization efficiency examines how effectively hardware and software resources are used during distributed testing. Metrics like CPU utilization and instructions per Joule are commonly used to gauge this. The aim is simple: maximize productive work while minimizing energy waste.
A 2024 study using the Fannkuch Redux benchmark on a MacBook Air (M1 chip) found that increasing the sampling rate from 10Hz (648.354J for ten executions) to 1kHz caused a 5.6% rise in energy consumption (684.754J). This was due to increased scheduler activity triggered by higher monitoring frequency. The takeaway? High-frequency monitoring can significantly affect resource efficiency.
One proven approach to improve efficiency is "racing to idle." This involves running tests at high power over a shorter period, allowing the system to return to a low-power idle state sooner. This is especially important because CPUs in a busy state can consume over 140 times more energy than when idle.
Carbon Footprint of Testing Operations
Beyond energy consumption, it’s essential to consider the carbon footprint of testing operations. This metric translates energy usage into environmental impact, factoring in compute nodes, interconnect fabrics (like switches), and cooling systems. It also accounts for grid carbon intensity, which varies depending on the energy mix used to power the system.
For throughput-heavy workloads, efficiency is often expressed as "Samples per Joule," while latency-sensitive tasks use "1/Joules" (inverse energy). These metrics help teams assess the environmental cost of their testing practices. Strategies like scheduling energy-heavy test cycles during off-peak hours or when renewable energy is more abundant can reduce this impact.
sbb-itb-7ae2cb2
Benchmarks from Recent Studies
Smart Grid Performance Metrics
Smart grid performance metrics provide a way to measure how efficiently energy is used in distributed testing environments. Two key metrics - Smart Grid Penetration Rate (SGPR) and Demand-Side Management Implementation (DSMI) - offer insights into energy optimization efforts. For example, a 2025 study reported an average Energy Efficiency (EE) score of 9.75. The SGPR metric revealed a coefficient of –3.69E–12, suggesting that integrating smart solutions early on leads to gradual improvements in efficiency. On the other hand, the DSMI metric, with a coefficient of –0.047, indicated that while initial investments or adjustments may temporarily hinder efficiency, they pave the way for long-term benefits.
Additionally, Grid Reliability Metrics (GRM) demonstrated a positive correlation of 0.335 with energy efficiency. This highlights the importance of a stable and reliable grid infrastructure in minimizing energy losses during operations. These findings provide a solid foundation for understanding energy efficiency benchmarks in data centers, where distributed testing environments reveal further dynamics.
Data Center Energy Benchmarks
Data center benchmarks delve into energy efficiency across distributed testing environments. The DCcluster-Opt framework models how factors such as grid carbon intensity, electricity costs, and hardware configurations (like CPUs and GPUs) interact across various regions. For instance, a November 2025 analysis of the PM100 dataset from the Marconi100 system at CINECA (Italy) examined 230,000 job records. The results were striking: jobs in the "Very Inefficient" category had an average Carbon Efficiency Score (CES) of 11.75 - 238 times higher than the "Very Efficient" group, which averaged just 0.049. Interestingly, high-emission jobs were often long-duration tasks with significant memory demands, rather than being primarily GPU-intensive.
"Energy efficiency is a critical aspect of modern distributed systems, especially as the demand for computational resources continues to increase."
- Jesus Benedicto, Systems Analyst/Software Architect, Atos (Eviden)
Another key finding was that memory-intensive jobs emitted nearly double the carbon per gigabyte compared to CPU-centric tasks (0.00446 kgCO₂/GB vs. 0.00241 kgCO₂/GB). This highlights the potential for significant carbon savings by optimizing memory usage during testing. Lastly, the GMB-ECC framework provides a way to benchmark energy efficiency across the edge-cloud continuum. By identifying gaps between current operations and their theoretical maximum efficiency, QA teams can focus their QA risk analyzer on their efforts on the distributed components most in need of optimization.
How to Improve Energy Efficiency in Testing
Optimizing Test Distribution Algorithms
The way tests are distributed through load balancing can significantly affect energy usage. By using AI-driven task allocation, power consumption can be cut by as much as 20% compared to traditional schedulers. Two approaches, Particle Swarm Optimization (PSO) and Proximal Policy Optimization (PPO), stand out. PSO usually achieves greater energy savings, while PPO works faster and is better suited for edge devices with limited resources.
Techniques like virtualization and containerization help consolidate resources, reducing the number of active servers and improving energy efficiency. Another effective strategy is to schedule energy-intensive tests during times of peak renewable energy availability. For instance, integrating an energy gate into the CI/CD pipeline can ensure renewable energy is available before running heavy test suites.
Architectural decisions also play a role. Switching from Direct to Fanout exchange strategies in messaging systems can reduce power consumption by up to 31%, as it eliminates the need for intensive routing key matching. Even the choice of search algorithms matters - random search algorithms often use less energy than complex genetic algorithms when dealing with code that has high cyclomatic complexity.
These algorithmic adjustments pave the way for AI-driven resource management, which is explored in the next section.
Using AI for Resource Optimization
AI has proven to be a game-changer for distributed testing systems, not only improving execution metrics but also slashing energy consumption. AI platforms automate resource management in ways manual methods simply can't match. For example, in early 2026, researchers at Dalhousie University applied the Energy Flow Graph (efg) model to optimize an AI pipeline fine-tuning ModernBERT-base on the BigVul dataset. By using a multiplicative cascade model to predict the combined effects of four optimizations, they achieved an 86.6% reduction in energy consumption, with predictions accurate to within 0.6%.
"The efg transforms energy optimization from trial-and-error to systematic analysis, providing a foundation for green software engineering across computational domains." - Saurabhsingh Rajput and Tushar Sharma
AI scheduling tools like Helios and EaCO have also shown impressive results, cutting energy use by up to 39% by dynamically shutting down idle nodes and fine-tuning GPU allocations.
Platforms such as Ranger combine AI-powered test creation with automated resource management, leading to optimized testing infrastructure without compromising reliability. By automating processes like test creation and maintenance, these tools reduce the computational load associated with manual testing.
Monitoring and Reporting Energy Metrics
Optimizing energy use with AI is only part of the equation - accurate monitoring of energy metrics is essential to close the loop. Tools like Intel's Running Average Power Limit (RAPL) provide real-time data on CPU and DRAM energy consumption. In containerized environments, process-level tools such as Scaphandre and PowerAPI can estimate power usage at the Process ID (PID) level. For Java-based testing, JoularJX offers method-level insights, tracking energy consumption during execution.
To further enhance efficiency during testing, consider implementing a "Zen Mode." This involves disabling unnecessary background services, ensuring devices are fully charged to minimize fluctuations, and avoiding external network interactions. In distributed systems, separating traffic generators and monitoring backends from the system under test prevents skewed measurements. Exporting energy metrics to tools like Prometheus and visualizing them with Grafana dashboards makes it easier to track consumption trends in real time.
It's also important to monitor CPU and memory usage across nodes to avoid bottlenecks caused by excessive resource consolidation. Automated tools like JNose can detect and address "test smells" - inefficient test design patterns that waste energy. Refactored tests consistently consume less energy than their poorly designed counterparts.
These monitoring strategies ensure continuous improvement in energy efficiency across distributed testing systems.
Conclusion
Summary of Metrics and Methods
Improving energy efficiency in distributed testing isn't just about saving money - it also enhances performance. Key metrics like energy consumption per test cycle and carbon footprint offer clear benchmarks for identifying inefficiencies in distributed test systems. By keeping a close eye on these, teams can pinpoint where improvements are needed.
The methods outlined earlier provide practical solutions. For example, fine-tuning test distribution algorithms can significantly cut down power usage. Similarly, redesigning inefficient tests helps reduce energy consumption without compromising test coverage. Since grid intensity varies, optimizing for these fluctuations can have a noticeable impact on reducing carbon emissions.
Smart scheduling plays a critical role here. By running energy-heavy tests during times when the grid's carbon intensity is lower, teams can turn energy efficiency into a tangible, trackable result. These strategies pave the way for integrating AI to make energy-conscious testing a seamless part of everyday workflows.
How AI-Powered Tools Like Ranger Help

AI-powered tools like Ranger take these concepts from theory to practice. Ranger automates test creation and maintenance, cutting down on the computational load of manual testing. At the same time, its AI-based resource management ensures that testing infrastructure is used as efficiently as possible.
Ranger's compatibility with CI/CD platforms like GitHub makes it easy to incorporate energy-efficient testing into existing processes. With real-time feedback, it quickly flags inefficiencies, allowing teams to address them on the spot. Plus, because Ranger operates on hosted infrastructure, there's no need for teams to manage energy-draining test environments themselves. For organizations juggling sustainability goals and cost management - especially when GPU-heavy workloads can drive up cloud expenses - Ranger offers a way to achieve both environmental and financial savings.
FAQs
How do I measure energy per test run accurately?
To get accurate energy measurements for each test run, use energy monitoring tools like RAPL to track real-time energy usage at the process level. Pair these tools with observability frameworks like OpenTelemetry to gather detailed metrics. Standardizing your measurement process is key to minimizing variability, and automating data collection helps maintain consistency. This approach ensures your energy measurements are precise, repeatable, and easy to compare across test runs.
Which metric should I track first: Joules, CPU use, or CO2?
Track Joules first, as it provides a direct measurement of total energy consumption and is the key metric for assessing energy efficiency. Metrics like CPU usage and CO2 emissions are secondary - they offer useful insights but depend on energy consumption data to provide meaningful context.
How can I schedule tests when grid power is cleaner?
You can plan tests during times or in places where the energy grid has a lower carbon intensity. This involves adjusting workloads to match grid conditions. Studies on workload timing and renewable energy usage show that syncing test execution with periods of cleaner energy availability can have noticeable benefits.
Related Blog Posts
Stop babysitting your coding agents. Use Ranger
More signals, less noise, faster launches
Let Ranger be your guide to sustainable QA testing.

.png)