How to Monitor QA in Continuous Testing

Monitoring QA during continuous testing ensures software quality while maintaining development speed. The key is to track metrics that matter, use tools that integrate with your CI/CD pipeline, and automate processes to identify issues early. Here's what you need to know:
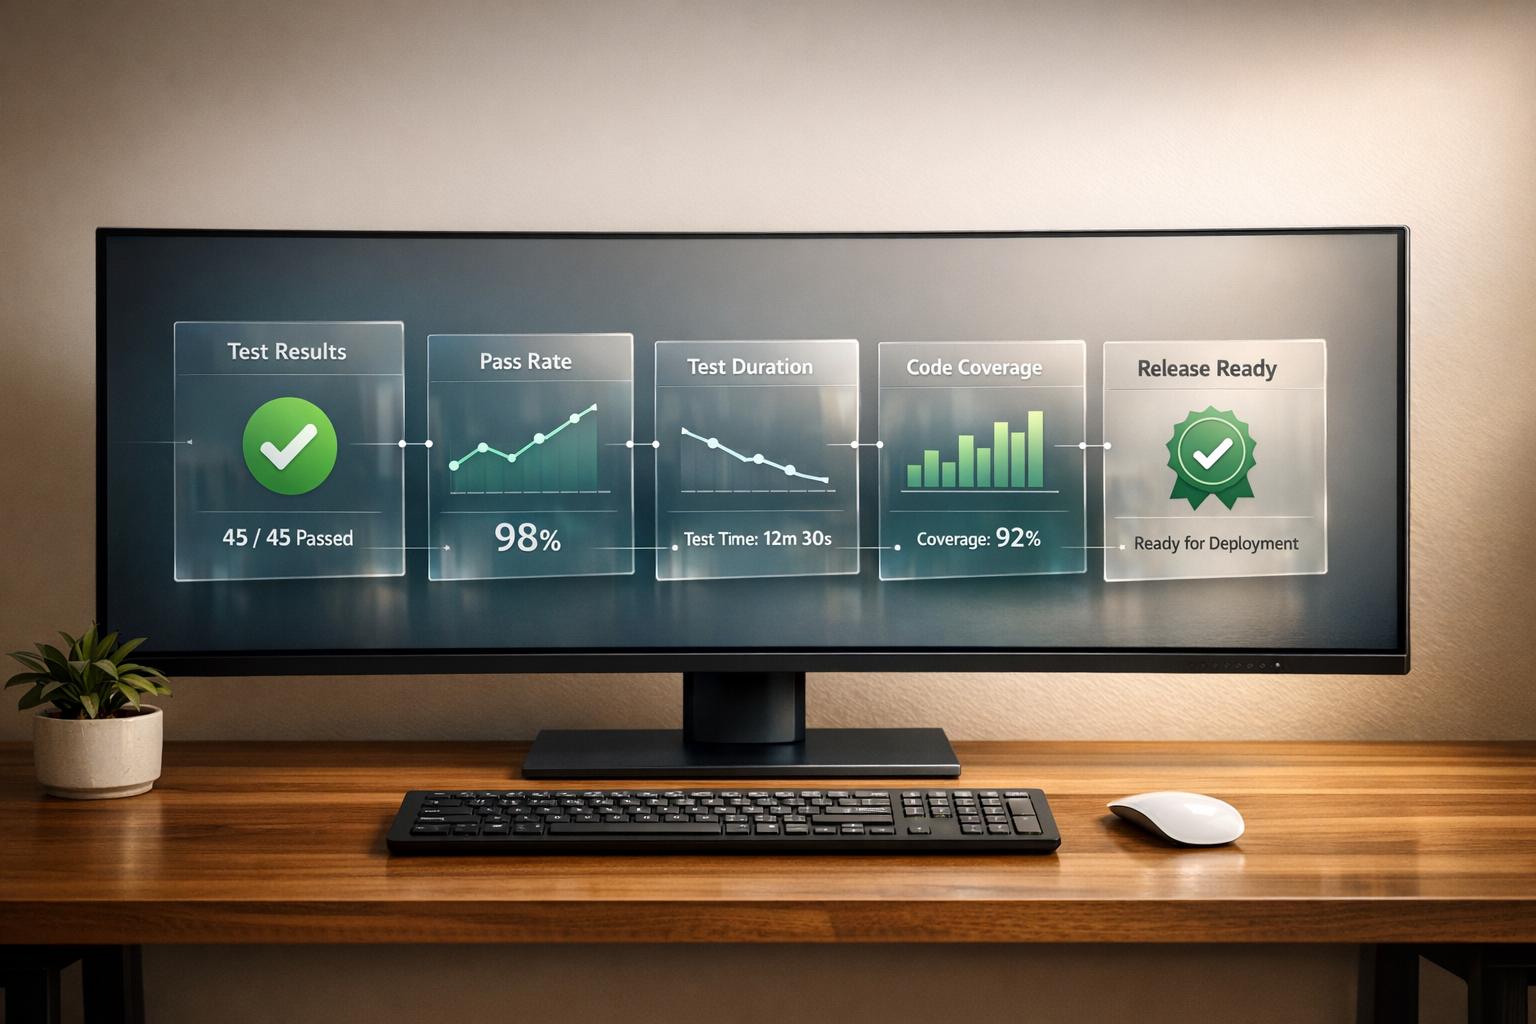
- Core QA Metrics: Focus on test pass rates, defect density, code coverage, test execution time, defect escape rate, test flakiness, and response times (MTTD/MTTR). These metrics provide actionable insights into your testing process.
- Tools to Use: Tools like Ranger, Jenkins, and GitLab CI/CD help automate testing and monitoring. Features such as real-time alerts, quality gates, and AI-driven test management streamline workflows.
- Testing Stages: Divide QA monitoring into pre-merge (unit/regression tests), integration (performance checks), and post-deployment (smoke tests). Automate these stages for efficiency.
- Alerts and Notifications: Set clear alert triggers for critical issues, performance degradations, and infrastructure warnings. Use Slack or email for timely team updates.
- Feedback Loops: Use dashboards to analyze metrics, detect patterns, and improve QA processes. Prioritize fixing flaky tests and aligning QA efforts with development goals.
Continuous Testing Demo
This demo showcases how to integrate E2E testing in CI/CD pipelines for more reliable releases.
sbb-itb-7ae2cb2
Key QA Metrics to Track

Essential QA Metrics for Continuous Testing: Benchmarks and Target Thresholds
Core Metrics for QA Performance
Tracking the right metrics is essential for understanding QA performance and ensuring software quality. Here are some core metrics to focus on:
Test pass rate: This metric reflects the overall health of your test suite. A pass rate above 95% is generally ideal for maintaining stability. However, be cautious - this number can be misleading if your tests lack depth or fail to cover critical functionalities.
Defect density: This measures the number of defects per 1,000 lines of code (KLOC). Aiming for 0–2 defects per KLOC is a solid benchmark, while rates exceeding 10 signal high-risk areas. This metric also highlights modules that might require more rigorous testing or even refactoring. For example, a 2024 case study revealed that stricter code reviews and better automated test coverage reduced defect density by 30% in just one release.
Code coverage: This metric shows the percentage of code executed during automated tests. While striving for 100% coverage isn’t practical, aiming for 80% - especially for critical business logic - is a more realistic and impactful target. Focus your efforts on high-risk, business-critical areas instead of chasing full coverage.
Test execution time: Shorter test times mean faster feedback. Ideally, test suites should complete in under 10 minutes. Quick feedback matters because fixing bugs discovered early on costs significantly less - up to 10–100 times less - than addressing them weeks later.
Defect escape rate: Also known as defect leakage, this tracks the percentage of bugs that make it into production. Keeping this rate below 5% is key, as production bugs are far more expensive to fix.
Test flakiness rate: Flaky tests, or those that yield inconsistent results, undermine reliability. Aim to keep flakiness below 2% to ensure your test suite remains dependable.
"QA metrics are more than just numbers; they are vital tools that provide a clear, objective view of your software testing process".
- Nikul Ghevariya, QA Executive at PixelQA
Mean Time to Detect (MTTD) and Mean Time to Repair (MTTR): These metrics measure how quickly defects are identified and resolved. Reducing both times is crucial for keeping bug-related costs in check.
Once these core metrics are defined, the next step is to establish baseline measurements to track progress effectively.
Setting Baseline Metrics
Baselines are the foundation for data-driven improvements. By measuring key QA metrics consistently over a sprint or release cycle, teams can establish a clear picture of their current performance. Without baselines, quality assessments remain subjective rather than grounded in data. These benchmarks also create a "shared language" between QA, engineering, and leadership, making it easier to justify investments in automation or new tools.
Automating baseline data collection through CI/CD tools like Jenkins or SonarQube ensures accuracy and saves valuable time. However, it’s important not to track too many metrics at once. Overloading teams with data can lead to "analysis paralysis", where no meaningful action is taken.
"The challenge isn't a lack of metrics; it's knowing which ones matter and how to use them without distorting behavior".
- David Stojanov, QA Engineer at TestDevLab
Regularly reviewing baselines with your team can encourage discussions and drive small but impactful process improvements. Shifting from reactive "bug-hunting" to proactive quality optimization becomes possible with effective baseline tracking. In fact, studies show that structured metric tracking can deliver a 204% ROI over three years, with benefits valued at approximately $3.34M.
Choosing QA Monitoring Tools
When selecting QA monitoring tools, focus on those that integrate seamlessly with your CI/CD pipeline. This ensures real-time visibility into test health, enabling you to quickly identify issues such as flaky tests, performance regressions, and recurring failure patterns.
Pick tools that work natively with platforms like Jenkins, GitLab CI/CD, GitHub Actions, or CircleCI. These integrations allow tests to trigger automatically and consolidate results into a single dashboard for easy access. Features like Quality Gates can block commits that introduce regressions, while Intelligent Test Runners skip irrelevant tests based on code changes, helping to reduce pipeline run times.
"Testing is great for finding defects you expect to happen, but many production defects are surprises."
- Rouan Wilsenach, Software Engineer
Real-time alerting is another must-have. Look for tools that connect with Slack and email to notify code owners immediately when failures occur. This eliminates the need for manual log checks and speeds up response times. For example, GitLab's QA framework uses a 15% difference threshold in stack trace comparisons to determine whether a test failure matches an existing issue, automating the triaging process and saving hours of manual work.
Once you’ve defined your key QA metrics, focus on tools that monitor these metrics and promptly alert your team to potential problems. Tools like Ranger take this a step further by incorporating AI-powered features to simplify QA monitoring.
Using Ranger for AI-Powered QA Monitoring
Ranger simplifies QA monitoring by combining AI-driven bug triaging with human oversight, enabling teams to quickly sort and prioritize issues uncovered during continuous testing. It delivers real-time signals about the health of your CI/CD pipeline, allowing developers to catch and address regressions before they make it to production.
What makes Ranger stand out is its direct integration with tools like Slack and GitHub, sending alerts straight to the platforms where developers already spend their time. This eliminates the need to toggle between dashboards, speeding up issue resolution. Ranger also offers automated test creation and maintenance, reducing the manual effort required to keep test suites aligned with your evolving codebase. Additionally, its hosted test infrastructure provides scalable capacity, so you don’t have to manage your own testing environments.
To complement Ranger, consider additional tools that enhance visibility into pipeline execution and resource metrics.
Adding Supporting Monitoring Tools
While Ranger centralizes QA insights, supporting tools can provide a broader view of your pipeline. CI/CD platforms like Jenkins and GitLab CI/CD include built-in monitoring for execution times and resource usage.
For example, Datadog's Intelligent Test Runner skips tests unrelated to specific code changes, saving both time and resources. Tools like Datadog and Sematext also offer free trials, allowing you to evaluate their compatibility with your workflow. When choosing additional tools, prioritize those that support structured logging (e.g., JSON format) for efficient failure analysis. Use standardized tagging to ensure that alerts are routed to the appropriate code owners via Slack or email.
Adding QA Monitoring to CI/CD Pipelines
Incorporating QA monitoring into your CI/CD pipeline ensures quality checks are part of the process without slowing down releases. By automating data collection and using APIs to feed real-time test data into an observability platform, you can track metrics from every test run - whether it's a unit test, integration test, or smoke test - all in one centralized dashboard.
This process works best when divided into three main stages: integration, delivery, and deployment. During integration, unit and integration tests should automatically trigger on every code push. In the delivery stage, performance checks and UI tests can run in staging environments, using automated load generation to simulate real-world scenarios. After deployment, smoke tests verify that essential features function correctly in production. This structured, multi-layered approach helps identify issues early and provides rapid feedback. Align these testing steps with the QA metrics you’ve already established.
"A QA pipeline is a structured process within the software development lifecycle that automates and streamlines testing workflows to ensure code quality, reliability, and functionality before deployment." - Maruti Techlabs
To ensure your team stays informed, integrate tools like Slack or email notifications for instant updates when a test fails. Ranger, for instance, connects seamlessly with Slack and GitHub, delivering alerts directly to the tools your team uses, reducing the need for context switching.
Standardizing environments with Docker across development, staging, and CI/CD ensures consistent results and avoids the dreaded "it works on my machine" problem. After deployment, wait 60–120 seconds for metrics to stabilize before acting on them, reducing the chance of false positives.
Setting Up Automated Monitoring Stages
Automating your testing stages ensures speed and efficiency. Start with fast unit tests for quick feedback, followed by slower integration and UI tests.
In pre-merge stages, regression and unit tests help catch bugs before they hit the main codebase. Since 62% of organizations cite testing as the main cause of CI/CD pipeline delays, prioritizing faster tests at this stage is crucial. After merging, focus on performance and reliability tests in staging to detect issues before production.
Leverage risk-based prioritization with machine learning to focus on areas affected by specific code changes. This approach avoids running unnecessary tests, cutting compute time while maintaining thorough coverage. Companies using AI-driven QA monitoring report release cycles that are 30–40% faster compared to manual methods.
In Jenkins pipelines, use the catchError function to ensure that even if a test stage fails, subsequent stages continue to execute. This allows for a full analysis before the Quality Gate decides whether to block the build.
| Pipeline Stage | Activity | Goal |
|---|---|---|
| Pre-merge | Regression & Unit Testing | Prevent bugs from entering the main codebase |
| Integration | Performance & Reliability Checks | Ensure new code meets speed and stability standards |
| Post-deployment | Smoke Testing & Synthetic Monitoring | Verify production stability and end-user experience |
With these automated stages, the final checkpoint - quality gates - ensures only reliable code advances.
Implementing Quality Gates
Quality gates act as the final safeguard, blocking deployments that don't meet specific thresholds. Metrics like code coverage, API response times, and error rates are commonly monitored. For instance, you might set a requirement for 80–90% code coverage on new code before allowing a build to proceed. These thresholds ensure consistent adherence to the QA metrics discussed earlier.
"Quality gates are predefined criteria that ensure only high-quality code progresses through the development pipeline." - Vivek Kumar Maskara, Developer Guide Author, SonarSource
Implement quality gates with shell scripts that poll Quality Gate APIs, enabling your pipeline to wait for analysis to complete without timing out. For example, a performance gate in GitHub Actions could query OpenTelemetry metrics from a Prometheus backend after a 60-second stabilization period. It might evaluate whether API P95 response times stay under 500ms and error rates remain below 1%. If these thresholds are breached, the script exits with a non-zero code, halting the deployment.
Store these performance thresholds in a version-controlled YAML file alongside your application code. This makes it easy to update and keeps everything transparent as your application evolves. Use the "four golden signals" - latency, traffic, errors, and saturation - as a baseline for performance-based quality gates.
Configure gates to block deployments in development or staging environments, while allowing production releases to proceed with warnings. For emergencies, include manual overrides that require approval from multiple stakeholders, such as development and QA leads.
Configuring Alerts and Notifications
In continuous testing, resolving issues quickly is key. Setting up accurate alerts ensures your team can act immediately when user-facing problems occur. Once quality gates are in place, a notification system should follow, delivering alerts that are both timely and accurate. Alerts act as the last line of defense against production issues. If they don’t fire when needed, users are left dealing with problems unnoticed. On the flip side, if they fire too often without reason, your team risks burnout from alert fatigue.
Rather than monitoring every internal signal, focus on symptom-based alerts that reflect what users experience. For example, users don’t care about a pod restart or a CPU usage spike - they care about slow loading times or application failures. Configure your alerts to catch signs of user-facing issues, such as increased latency, higher error rates, or reduced availability. For situations where immediate action isn’t required, dashboards can be a better alternative.
"Alerts without ownership are often ignored. Every alert must have an owner: a team responsible for maintaining the alert and responding when it fires." - Grafana Documentation
Each alert should include essential details: what happened, where it occurred, why it happened, and what to do next. Enhance notifications with actionable features, like interactive Slack buttons for "Acknowledge" or "Snooze", and include links to runbooks or dashboards to speed up response times. Tools like Ranger can integrate with Slack and GitHub, delivering alerts directly to platforms your team already uses. Clearly defined alert triggers can automate these notifications efficiently.
Defining Alert Triggers
Alert triggers are thresholds set for specific metrics like error rates, response times, or resource usage. These triggers activate when a metric surpasses a static limit or a percentage threshold. To avoid unnecessary alerts from temporary spikes, enforce a confirmation window of 5–10 minutes. For log-based metrics, use a rolling window of at least 10 minutes to ensure data consistency.
Alerts can be scoped at different levels:
- Test-level: Monitors the entire test run.
- Page-level: Tracks metrics like DOM load time or Largest Contentful Paint.
- Transaction-level: Measures the duration of specific API calls.
- Certificate-level: Keeps an eye on SSL/TLS expiration.
For global applications, consider splitting detectors by location, allowing you to set unique thresholds for different regions. Define rules for missing data - whether incidents should remain open, auto-close after a period, or flag the absence of data as a violation. For instance, Google Cloud Monitoring automatically closes incidents after seven days of no data.
| Alert Type | Severity | Primary Recipient | Recommended Channel |
|---|---|---|---|
| Critical Test Failures | Critical | On-call Engineer / DevOps | PagerDuty / Slack (#incidents) |
| High Error Rate (SLO Burn) | Critical | Service Owner / Engineering | PagerDuty / MS Teams |
| Performance Degradation | Warning | QA Team / Developers | Slack (#qa-alerts) / Email |
| Infrastructure (CPU/Memory) | Info/Warning | Platform / SRE Team | Dedicated Slack channel / Dashboard |
Setting Up Team Notifications
Once triggers are set, it’s time to route notifications effectively. Match notifications to severity and ownership. For instance, critical alerts (SEV-1) like service outages or quality gate failures should go to paging systems like PagerDuty and dedicated incident channels. Major alerts (SEV-2), such as performance drops or high error rates, can be routed to service-specific Slack channels for triage during business hours. Informational alerts, like capacity warnings, are better suited for digest channels reviewed periodically.
To minimize context switching, map monitoring sources to specific Slack channels based on team ownership. For example, use channels like #svc-payments-prod or #platform-infra. Group related alerts - such as high latency and rising error rates from the same database issue - into a single notification to avoid overwhelming the team with redundant messages. Set up routing trees to define notification policies by service scope and priority, ensuring the right team gets the right alerts. Additionally, tag code ownership across CI tests so failures automatically notify the responsible owner. Periodically run fire drills with synthetic alerts to confirm that on-call engineers respond within SLAs and that runbooks are up-to-date.
Creating Feedback Loops for QA Improvement
When paired with robust monitoring and alert systems, well-designed feedback loops can transform raw data into meaningful QA enhancements. By addressing bottlenecks and catching defects early, monitoring data becomes a powerful tool for improving quality assurance. But for feedback loops to work effectively, platform and development teams must share visibility into the same test and CI pipeline data. This shared context is essential for collaboration - platform engineers can identify issues, but without engineering context, they can’t resolve them. Meanwhile, developers may remain unaware of systemic problems without access to this data. Real-time dashboards are key here, offering a shared, actionable view for both leadership and engineering teams.
"Platform engineers are responsible for maintaining the health and reliability of CI/CD pipelines... but they don't have the engineering context to be able to directly fix the test." - Bowen Chen, Datadog
Centralizing test execution data from all tools into a single platform provides a complete view of the testing lifecycle. This approach makes it easier to recognize patterns, like recurring test failures or performance regressions, and enables teams to prioritize fixes based on actual impact rather than assumptions.
Using Dashboards for Metrics Analysis
Real-time dashboards are game changers for turning monitoring data into actionable insights. They track critical metrics, highlight bottlenecks, and reveal trends over time. For instance, monitoring test durations can help pinpoint areas where slowdowns occur. Dashboards can also be customized depending on the audience: leadership might need a strategic overview, while engineering teams rely on detailed, real-time metrics. Automated anomaly detection, powered by AI, further enhances these dashboards by flagging test durations that deviate significantly from historical averages, signaling potential performance issues. Tools like Ranger’s AI-powered QA testing even integrate with platforms like Slack and GitHub, bringing these insights directly into your team’s daily workflow.
Refining QA Processes with Data
Once you’ve identified the right metrics to track, the next step is using that data to refine your QA processes. Start by prioritizing flaky test remediation based on how often they occur and their impact. Shift-left testing is another effective strategy - run preliminary tests as soon as a Pull Request introduces a new unit test to catch issues early, before they affect the main codebase. Automating the tagging of flaky tests, where a single commit produces both pass and fail outcomes, can streamline troubleshooting. Implement quality gates to block commits that introduce excessive flaky tests. Intelligent test runners can also help by skipping unrelated tests, reducing CI resource usage. Additionally, pipelines can be set to rerun failed tests individually; if they pass on subsequent attempts, they can be confirmed as flaky, simplifying the debugging process.
"Creating quarterly reports that summarize each repository's flaky tests and performance regression trends can help engineering leadership make data-driven decisions [and] track the effectiveness of remediation efforts." - Datadog
Using these insights, teams can iteratively refine QA practices and improve pipeline efficiency. Incorporating QA dashboards into sprint and release retrospectives helps teams assess progress and identify areas for improvement. Filtering metrics by specific release cycles or branches also provides valuable historical insights, allowing teams to measure the effectiveness of their efforts over time.
Conclusion
Keeping an eye on QA during continuous testing goes beyond simply gathering data - it's about turning that data into meaningful improvements. Start by focusing on the right metrics. Combine quantitative measures, like escaped bugs, with qualitative ones, such as test coverage. Establishing baselines helps you compare current performance to past benchmarks, making it easier to catch long-term regressions that could otherwise go unnoticed.
Once metrics are in place, selecting the right tools becomes essential. Tools like Ranger's AI-powered QA testing integrate seamlessly into your CI/CD pipeline. They offer automated test creation guided by human oversight and provide real-time alerts through platforms like Slack and GitHub. This blend of automation and intelligence speeds up bug detection while reducing distractions caused by flaky tests. Consolidating test execution data into a single platform ensures complete visibility.
Quality gates and automated alerts play a vital role by preventing problematic commits from moving forward and ensuring notifications reach the right teams. By routing alerts directly to designated code owners, these systems streamline communication. This level of automation is critical, especially since 62% of organizations cite testing as the main reason for pipeline delays.
Integrated feedback loops bring everything together. Dashboards allow teams to track trends, prioritize fixing flaky tests, and adopt shift-left testing strategies to catch issues earlier in development. Teams leveraging AI-powered QA report release cycles that are 30% to 40% faster compared to manual-heavy methods.
FAQs
Which QA metrics should we track first?
To kick off tracking in a continuous testing environment, focus on test coverage, defect detection rate, and test execution progress. These metrics give you a quick snapshot of how effective your testing is and how well your system performs.
On top of that, keeping an eye on automation effectiveness and test stability can fine-tune your testing efforts, cutting down on unreliable or flaky tests. Together, these metrics lay the groundwork for assessing and refining the overall health of your QA process.
How do we set quality gate thresholds without blocking releases?
To establish quality gate thresholds that don't hinder releases, aim for flexible thresholds that account for variations in testing outcomes. Using AI-driven adaptive thresholds, which rely on historical data to adjust dynamically, can help minimize false positives. Prioritize key metrics like performance or error rates, and define acceptable ranges instead of rigid limits. By integrating automation, adaptive thresholds, and well-defined exception criteria, quality gates can improve testing processes without causing release delays.
How do we cut alert noise without missing real issues?
To keep alert noise under control while still catching genuine issues, it's important to focus on a few key strategies. Start by prioritizing alerts - make sure high-priority alerts stand out from the low-priority ones. Use dynamic thresholds that adjust based on changing conditions, so you're not stuck with rigid settings that trigger unnecessarily. Incorporating AI-driven correlation can also help by filtering out irrelevant notifications and highlighting patterns that matter.
Another essential step is to regularly audit your alerts. This ensures that every alert is still relevant and aligned with your current needs. By striking the right balance between sensitivity and selectivity, your team can zero in on critical, business-impacting problems without being bogged down by false alarms or minor issues.
Related Blog Posts
Stop babysitting your coding agents. Use Ranger
More signals, less noise, faster launches
Let Ranger be your guide to sustainable QA testing.

.png)