Automated Performance Testing for CI/CD: A Guide


Automated performance testing ensures your application can handle high traffic and meet user expectations. By integrating these tests into your CI/CD pipeline, you can catch performance issues early, reduce manual errors, and maintain deployment speed. Here's what you need to know:
- Why It Matters: Delays as short as 1 second can lower conversion rates by 7%. Automated testing helps avoid this by validating response times, error rates, and throughput under real-world conditions.
- Types of Tests: Smoke tests for quick checks, load tests for typical traffic, stress tests for breaking points, spike tests for traffic surges, and soak tests for long-term stability.
- Key Metrics: Response times (focus on p95/p99 percentiles), error rates, throughput, CPU usage, memory availability, and disk queue length.
- Pipeline Integration: Run lightweight smoke tests after every commit, intensive tests in staging, and synthetic monitoring in production.
- Tools: Choose tools that integrate with CI/CD systems, support cloud execution, and offer automated pass/fail criteria. AI-driven platforms like Ranger can simplify test maintenance and improve accuracy.
How to add performance testing to CI/CD pipelines using k6 and GitHub Actions
sbb-itb-7ae2cb2
Performance Testing Basics for CI/CD Pipelines
Performance Testing Integration Across CI/CD Pipeline Stages
To seamlessly integrate performance testing into CI/CD pipelines, it’s essential to understand the various types of tests and the metrics they rely on.
Types of Performance Tests
Each type of performance test serves a specific purpose. Smoke testing is the first step, running minimal iterations to confirm that test scripts and basic system functionality are ready for further testing.
Load testing evaluates how your system handles typical production traffic, helping establish a baseline for responsiveness and throughput under normal conditions. On the other hand, stress testing pushes the system to its limits, identifying breaking points and testing recovery mechanisms like auto-scaling.
When preparing for high-traffic events like product launches or flash sales, spike testing becomes indispensable. It ensures the system can manage sudden traffic surges without failing. Soak testing, also known as endurance testing, simulates sustained loads over extended periods, revealing issues like memory leaks or resource exhaustion that might not surface in shorter tests. Finally, scalability testing examines how well your system performs when additional resources are introduced.
Metrics to Track
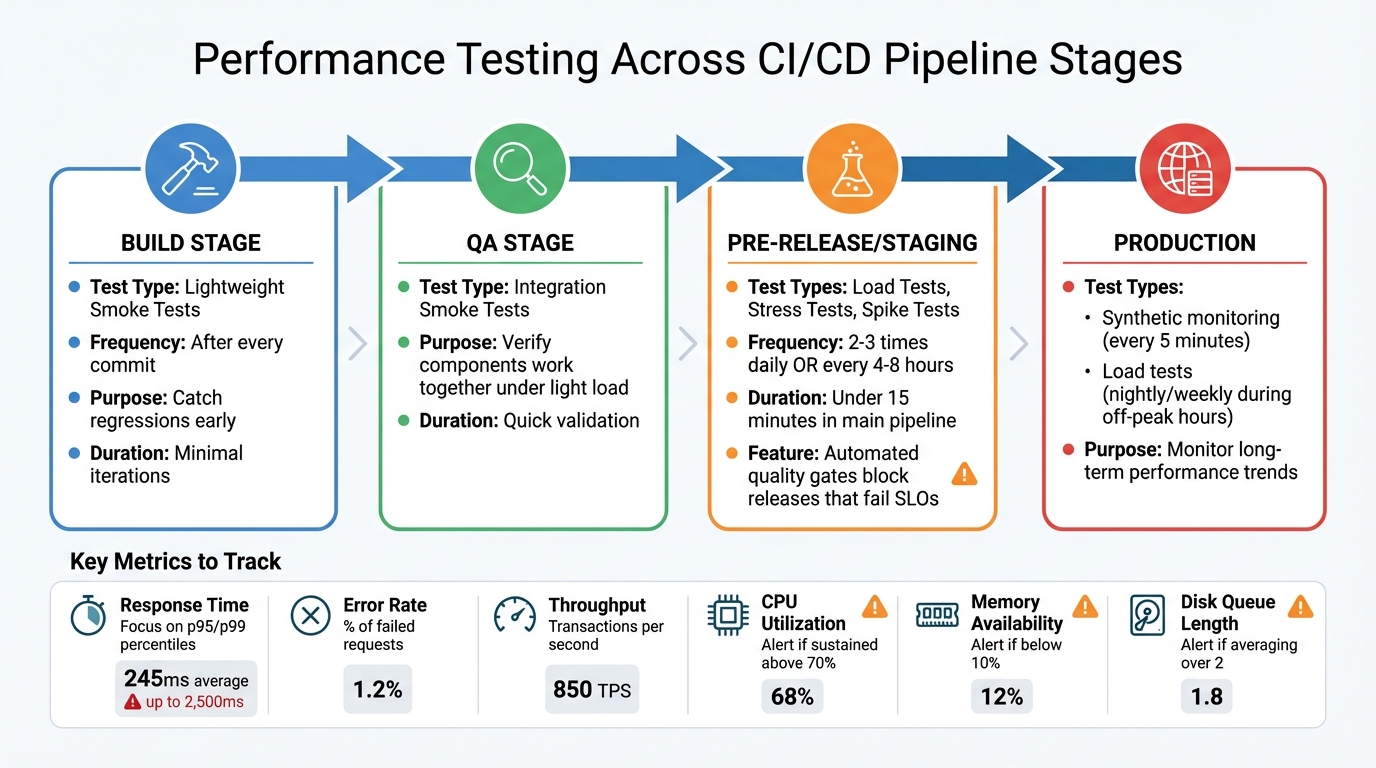
Clear metrics are essential for determining whether a performance test passes or fails. Response time is a key metric, measuring how long it takes to process a request. To get a full picture, focus on p95 and p99 percentiles, which highlight worst-case scenarios that averages might hide. For example, while a 245ms average response time seems excellent, some users might still face delays of up to 2,500ms.
Error rate tracks the percentage of failed requests, serving as an early warning of instability or resource exhaustion. Throughput measures how many transactions per second your system can handle. On the infrastructure side, monitor CPU utilization (sustained levels above 70% indicate high pressure), memory availability (falling below 10% can lead to performance-draining page faults), and disk queue length (averaging over 2 points to a hardware bottleneck).
These metrics guide how and where to integrate performance testing into your CI/CD pipeline.
Where Performance Tests Fit in CI/CD
Each stage of the CI/CD pipeline benefits from specific types of performance tests. During the build stage, lightweight smoke tests should run after every commit to catch regressions early. In the QA stage, integration smoke tests can verify that components work together under light load, often managed by a fully-automated QA engineer solution.
The pre-release or staging stage is where the more intensive tests - like load, stress, and spike tests - should occur. Automated quality gates can block releases that fail to meet Service Level Objectives (SLOs). However, avoid running tests longer than 15 minutes in the main deployment pipeline. Instead, schedule these tests every 4–8 hours in a separate environment to maintain deployment speed.
In production, synthetic monitoring can perform smoke tests every 5 minutes, while load tests can be scheduled during off-peak hours (such as nightly or weekly) to monitor long-term performance trends. By layering tests across the pipeline, you can catch issues early without sacrificing deployment velocity.
Planning Your Performance Tests
Before diving into performance testing, it’s essential to have a clear plan that ties your business goals to measurable outcomes. This phase lays the groundwork for deciding which tests to run, the timing, and how to define success.
Setting Performance Goals
Start by focusing on the critical user actions that directly impact your business - think login, search, adding items to a cart, or completing a checkout. These are the moments that drive revenue and user satisfaction.
To set realistic performance benchmarks, analyze your current traffic patterns using analytics and monitoring tools. For instance, you'll likely find that simpler actions, like GET requests, happen far more often than complex processes like checkout. Understanding these patterns allows you to create workload models that mimic real user behavior, including natural pauses between actions.
Don’t forget to account for peak traffic scenarios, like product launches or holiday shopping surges. During these high-traffic periods, even minor slowdowns can have a big financial impact. Your performance goals should reflect these challenges.
Converting Business Goals into Metrics
Once you’ve pinpointed the most important user flows and expected traffic, translate these into specific Service Level Objectives (SLOs). For example, if your goal is a seamless checkout experience, your SLO might require the checkout API to respond in under 2 seconds with an error rate below 0.1% during peak traffic.
Here’s a real-world example: An online retailer prepping for December 2024 holiday traffic used WebLOAD to simulate 10,000 users completing a purchase. By setting strict SLAs - like a checkout time under 2 seconds - they identified bottlenecks early and reduced checkout latency by 30% before the busy season began.
You can also incorporate these SLOs into your CI/CD pipeline. For instance, you could block a deployment if API response times exceed 2 seconds or if error rates rise above 1%. Setting thresholds for performance degradation - such as alerting only when scores drop by more than 5 points - helps filter out minor fluctuations to avoid unnecessary noise.
With clear metrics in place, you’re ready to explore tools that can seamlessly integrate into your CI/CD pipeline.
Choosing Performance Testing Tools
Selecting the right performance testing tools is crucial. Look for tools that feature a command-line interface (CLI) and integrate easily with CI/CD systems like Jenkins, GitHub Actions, or GitLab CI/CD runners. Tools that support distributed cloud execution are especially valuable, as running all tests from CI/CD nodes can lead to unrealistic results.
Key features to prioritize include automated success/fail criteria (like k6 thresholds), built-in observability integration, and modular scripting for easy reuse across different environments. Separating test logic from configuration simplifies maintenance as your application evolves.
Platforms powered by AI, such as Ranger, can take your testing to the next level. These tools streamline the process by automating test creation, identifying bottlenecks, and generating detailed performance reports. They also integrate smoothly with development workflows through tools like Slack and GitHub, reducing manual effort while ensuring tests remain aligned with real-world user behavior.
Start small with a few key scenarios and gradually expand your test coverage. Modular test scripts are essential - they make it easier to adapt as your application grows and workloads shift.
Setting Up Automated Performance Tests
Building Realistic Test Scenarios
To create performance tests that reflect how users actually interact with your application, start by analyzing your production traffic. Tools like analytics platforms can help you pinpoint the most frequently accessed endpoints and map out user behaviors - such as navigating from a search page to product listings and then to checkout.
A hybrid approach works best here. Simulate backend HTTP requests at scale to test server performance, while running a few browser-based tests to ensure the frontend renders correctly. This is crucial because backend response times tend to grow exponentially with more concurrent users, whereas frontend response times are usually more stable.
Make your tests as realistic as possible by incorporating elements like data correlation, think times that mimic actual user pauses, and varied test data (e.g., different product IDs or user credentials). You can even record real user sessions using browser tools to establish a baseline scenario. Once recorded, refine the generated script to include dynamic variables for more accurate testing.
To keep your testing process flexible, separate the user actions (the scenario) from the number of users (the workload). This modular approach makes it easier to reuse scripts for different types of tests, whether you’re running smoke tests, stress tests, or soak tests.
When your scenarios are ready, integrate them into your CI/CD pipeline for seamless execution.
Adding Tests to Your CI/CD Pipeline
Adding performance tests to your CI/CD pipeline involves several key steps: generating test data, choosing the right tools, running tests with error monitoring, reporting results centrally, and resetting environments after each run. The goal is to align the test type with the specific environment.
For QA or development branches, run smoke tests on every code change. These tests involve minimal load - sometimes just one iteration - to ensure scripts are functional and catch basic regressions. In staging or pre-release environments, schedule average-load and stress tests two to three times a day. Use quality gates to automatically fail the build if metrics exceed your Service Level Objectives (SLOs). In production environments, low-load synthetic monitoring tests during off-peak hours can track performance trends without disrupting real users.
To maintain accuracy, ensure that each test run is linked to specific code changes using metadata. Configure the pipeline to execute only one performance test at a time, avoiding resource contention that could skew results. Additionally, use "abort on fail" thresholds, stopping tests if error rates exceed 1%. This prevents overloading a system that’s already struggling.
"Performance testing automation is about establishing a repeatable and consistent process that checks reliability issues at different stages of the development and release cycle." - Grafana k6
Setting Up Test Environments
Your test environment should closely resemble production to provide accurate performance insights. If a smaller staging environment is used, limit tests to functional smoke validations. Tools like Terraform or Ansible can help define these environments, ensuring configurations match production settings precisely.
For optimal results, dedicate a separate environment for performance testing. Automate the setup and teardown of resources for every test run to avoid misconfigurations. Generate realistic test data that covers a variety of scenarios, and reset databases to their original state after testing by rolling back any changes made during the process.
If you’re testing in the cloud, watch for CPU and memory quota limits. Request increases if your expected load surpasses the default limits. For serverless or containerized apps, set a minimum number of instances (e.g., at least one) to avoid cold starts that could artificially inflate latency metrics. When simulating high traffic, use multiple IP addresses for load generators to avoid throttling by the target system.
During testing, monitor these four critical hardware areas:
- Physical Disk: Aim for an average queue length below 2.
- Memory: Ensure available memory stays above 10%.
- Processor: Keep CPU utilization at or below 70%.
- Network: Watch for bottlenecks that could cascade into other areas.
These components are interconnected, so a problem in one can quickly ripple through the rest of the system. Keep an eye on them all to get the most accurate results.
Running and Scaling Performance Tests
Tracking Performance Over Time
Centralizing test results is essential for monitoring aggregated metrics and time series data. This approach helps establish a historical baseline, allowing you to detect performance trends and spot regressions before they impact production. The secret to meaningful insights? Consistency. You need to run identical test scenarios using the same workload, data, and environment to ensure fair comparisons - what you'd call "apples-to-apples."
To dig deeper, link your performance test results with system-level observability data - like CPU usage, memory consumption, or SQL query speeds. This connection can help you identify the root cause of performance issues, such as spikes in response times. Adding unique identifiers to request headers during testing can also simplify filtering logs and tracing data when developers investigate specific test runs.
Automating quality gates with pass/fail thresholds in your CI/CD pipeline can act as a safeguard for releases. However, these thresholds need careful tuning to minimize false positives. Even minor delays can have a noticeable effect on conversion rates.
"Automation changes this approach - from reactive to proactive." - k6 Documentation
By following these practices, you'll be better prepared to scale your performance tests in dynamic environments.
Scaling Your Tests
Forget about running large-scale tests on local machines. Instead, leverage cloud-distributed load generation to scale horizontally and achieve more realistic results. To keep things efficient, separate your test logic from workload settings, making it easier to reuse tests across different scenarios.
Balancing test coverage with pipeline speed is a delicate act. Layer your tests strategically: start with lightweight smoke tests for every code change, move to average-load tests in staging, and save large-scale stress tests for pre-release environments. Gradually increase concurrency during consecutive test runs - for example, from 1 to 100 to 1,000 users - to pinpoint where performance starts to degrade. To avoid wasting cloud resources, set automated abort conditions that stop tests if they threaten to overload the system.
As your testing needs grow, advanced automation platforms become indispensable for managing the complexity.
Using AI-Powered Platforms Like Ranger
Once you’ve nailed down tracking and scalable test execution, AI-powered platforms can take your performance testing to the next level by streamlining the process within CI/CD pipelines.
One major advantage of AI-powered platforms is their ability to reduce the maintenance burden that comes with scaling tests. Traditional scripted automation can eat up 30–40% of a QA team’s time, but AI can adapt test scripts in real time by detecting application changes. For example, Ranger integrates with tools like Slack and GitHub, automating test creation and updates while delivering consistent results.
These platforms also help avoid pipeline slowdowns by analyzing code changes and running only the tests that matter. When failures occur, they investigate by examining DOM snapshots, network activity, and execution logs to determine whether the issue stems from a genuine bug or environmental noise. Teams using AI-powered testing have reported an 85% reduction in test maintenance efforts and can create tests up to 10× faster compared to manual scripting.
"The fundamental problem is that conventional automation can't keep up with modern development velocity. Your application is evolving faster than your test suite can adapt." - Abbey Charles, mabl
To get started, focus on automating a subset of high-impact tests. Expand the scope as the AI system proves its reliability. During the early phases, include a human-in-the-loop review to validate AI decisions and ensure the system trains on high-quality data. With time, you’ll have a robust, efficient testing process that keeps pace with your development needs.
Conclusion
Main Takeaways
Performance testing isn't just a box to check - it's a critical step in ensuring your CI/CD pipeline delivers reliable, high-quality software. The most effective teams treat it as a proactive measure, addressing potential issues before they ever reach production. By aligning performance tests with your business objectives and weaving them into your CI/CD workflow, you can identify and resolve bottlenecks early. In fact, incorporating performance testing early in the software development lifecycle can reduce production-related issues by up to 30%.
Consider this: 53% of users will abandon an application that runs too slowly. Meanwhile, automated CI/CD pipelines have been shown to increase deployment frequency by 75% while slashing manual errors by 90%. Tools powered by AI, like Ranger, can simplify test maintenance and speed up test creation, freeing up your team to focus on innovation instead of tedious script updates. These numbers highlight just how essential performance testing is to your CI/CD process.
"The best implementations treat performance testing as a mandatory quality gate, not an optional step." - Hokstad Consulting
Best Practices
To strengthen your performance testing strategy, here are some proven approaches to consider:
- Start small and grow: Begin with a handful of tests that cover your application's most critical user paths. Gradually expand your test coverage as you gain insights and refine your process.
- Integrate and automate: Incorporate performance tests at every stage of your pipeline and automate as much as possible. Storing test scripts alongside your application code in version control ensures they evolve together.
- Leverage real-world data: Use production analytics tools like Google Analytics or server logs to craft test scenarios that mirror actual user behavior.
- Run tests in parallel: Utilize Docker containers or cloud-based load generators to execute tests simultaneously, preventing them from slowing down your pipeline.
- Tweak with precision: When optimizing your system, adjust one variable at a time. This approach makes it easier to pinpoint what changes impact performance, whether for better or worse.
- Automate data management: Sync and anonymize production-scale data to uncover genuine performance bottlenecks without compromising sensitive information.
FAQs
How does automated performance testing enhance CI/CD workflows?
Automated performance testing plays a crucial role in improving CI/CD workflows by providing fast and continuous feedback on application latency, scalability, and overall performance. It’s designed to catch bottlenecks early in the development process, helping to prevent performance problems from making their way into production.
By automating these tests, teams can cut down on manual work and save valuable time. This not only speeds up release cycles but also ensures that the software consistently meets performance benchmarks - an essential factor in today’s fast-moving development environment.
What are the most important metrics to track during performance testing?
When diving into performance testing, there are a few critical metrics to keep an eye on:
- Response time (latency): This tells you how fast your system reacts to a given request - basically, the time it takes to deliver a response.
- Throughput: This measures how many requests your system can handle per second, giving insight into its capacity.
- Error rate: Keeps track of the percentage of requests that fail, helping you gauge the system's reliability.
- Scalability: Looks at how well the system handles increased demand, including how resources like CPU and memory are utilized under heavier loads.
By focusing on these metrics, you get a solid understanding of how your system is performing and where adjustments might be needed.
How can AI-powered tools improve performance testing in CI/CD pipelines?
AI-driven tools simplify performance testing in CI/CD pipelines by automating the process of spotting anomalies in test results. They also offer insightful analysis to help pinpoint root causes. This not only cuts down on manual work but also speeds up debugging, enabling quicker delivery of reliable, high-quality software.
These tools can adjust to changes in your application by automatically updating and maintaining test cases. This saves time and boosts precision, allowing teams to dedicate their energy to creating new features rather than getting bogged down by repetitive testing tasks.
Related Blog Posts
Stop babysitting your coding agents. Use Ranger
More signals, less noise, faster launches
Let Ranger be your guide to sustainable QA testing.

.png)